Ask what AI is changing at work
Anthropic has made its Claude-usage data conversationally explorable, giving us a simpler route from a broad concern to inspectable evidence.
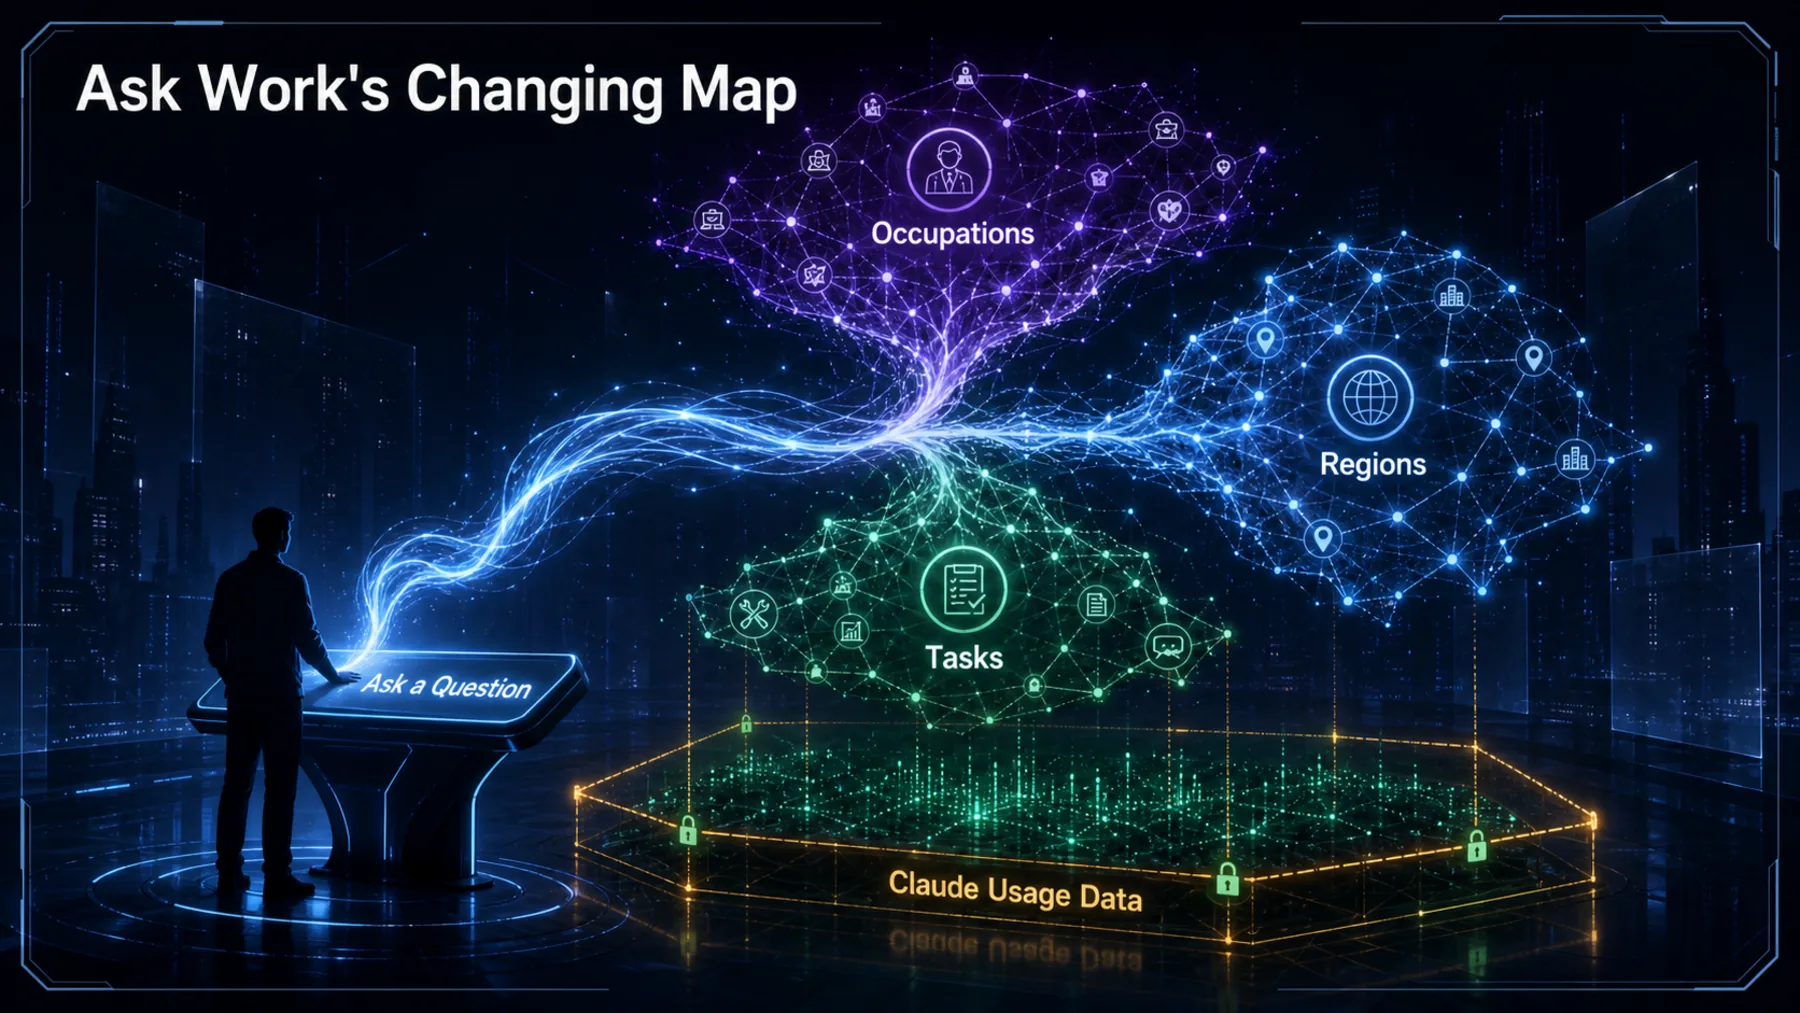
What is AI actually changing in work like ours? Until now, exploring Anthropic’s Economic Index meant approaching it as a dataset. Its new Claude connector lets us begin with that ordinary question instead.
We can ask about an occupation, region or task, refine the question and inspect the underlying data. The boundary matters from the start: the Index records patterns in Claude usage, not the whole labour market.
From anxiety to inspectable evidence
A conversational route into the Index can make a sprawling question more precise without making the evidence more complete.
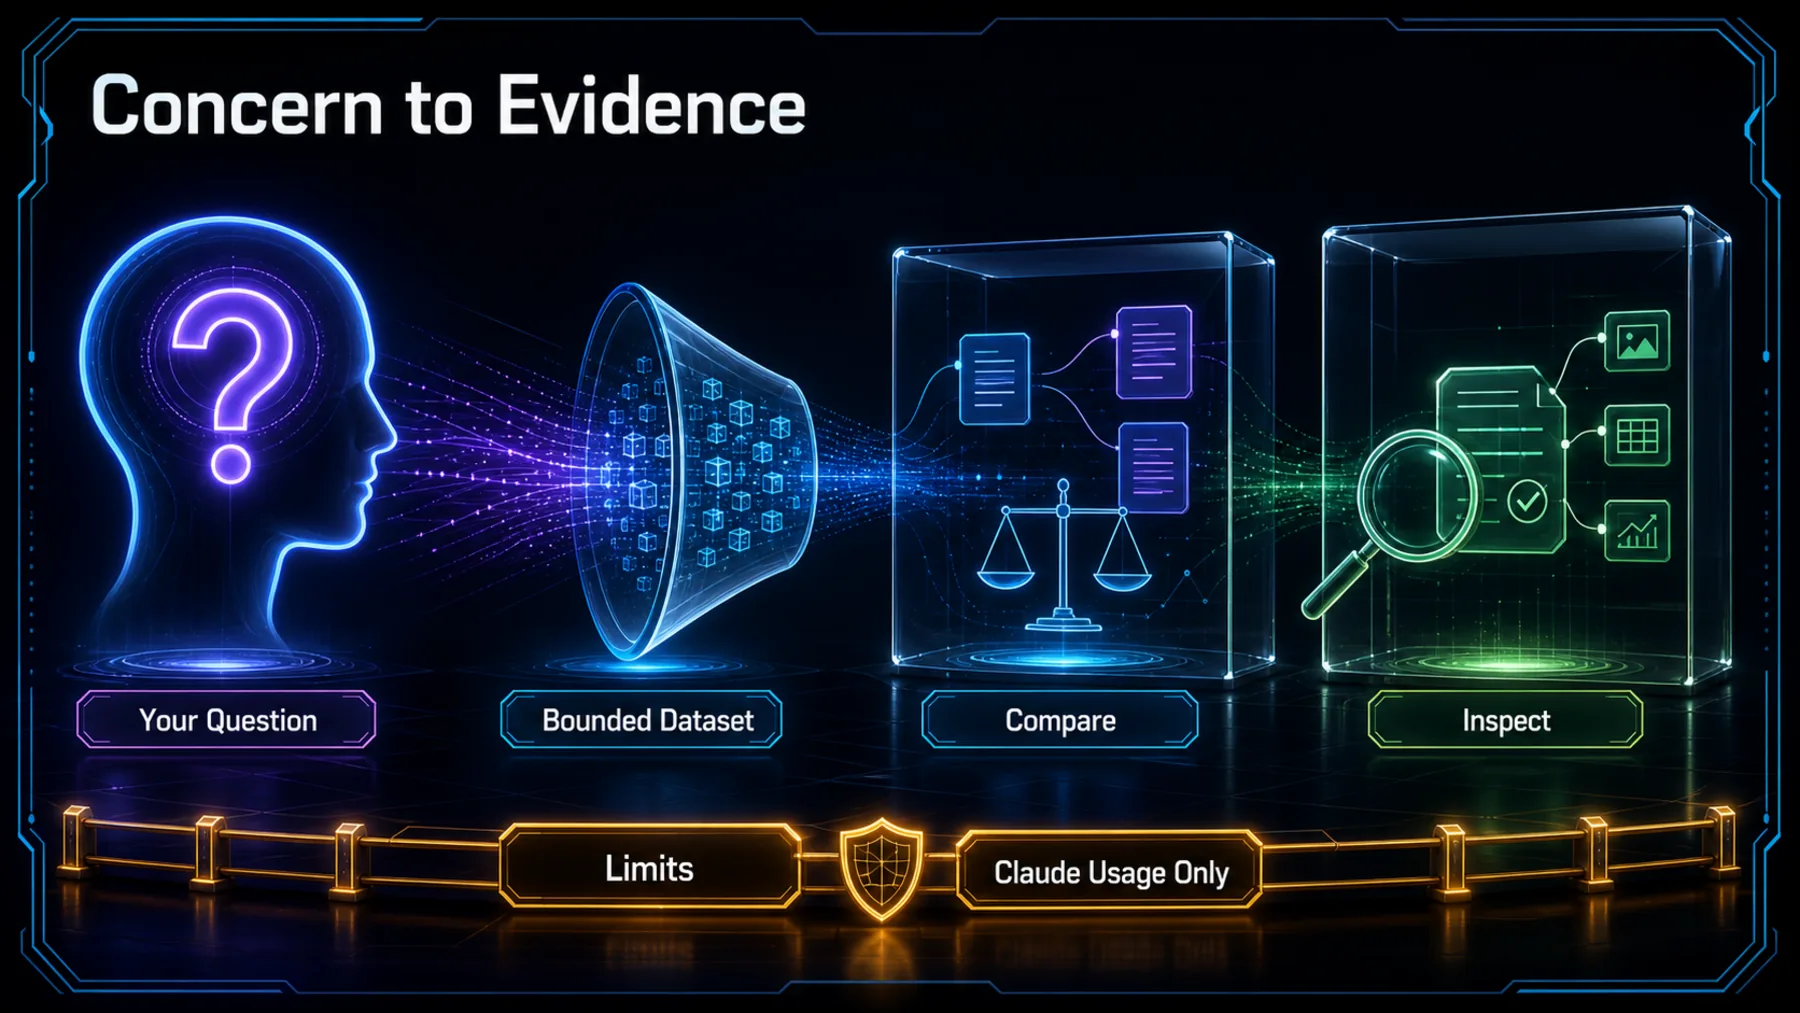
Questions about AI and work often arrive at the largest possible scale: which jobs are changing, which tasks are being automated and what any of it means for us. The connector offers a more practical opening by letting us ask those questions in ordinary language.
That convenience does not turn Claude usage into an economy-wide measure. Its value lies in helping us move from a vague concern towards evidence that can be examined on its own terms.
One dataset, several useful angles
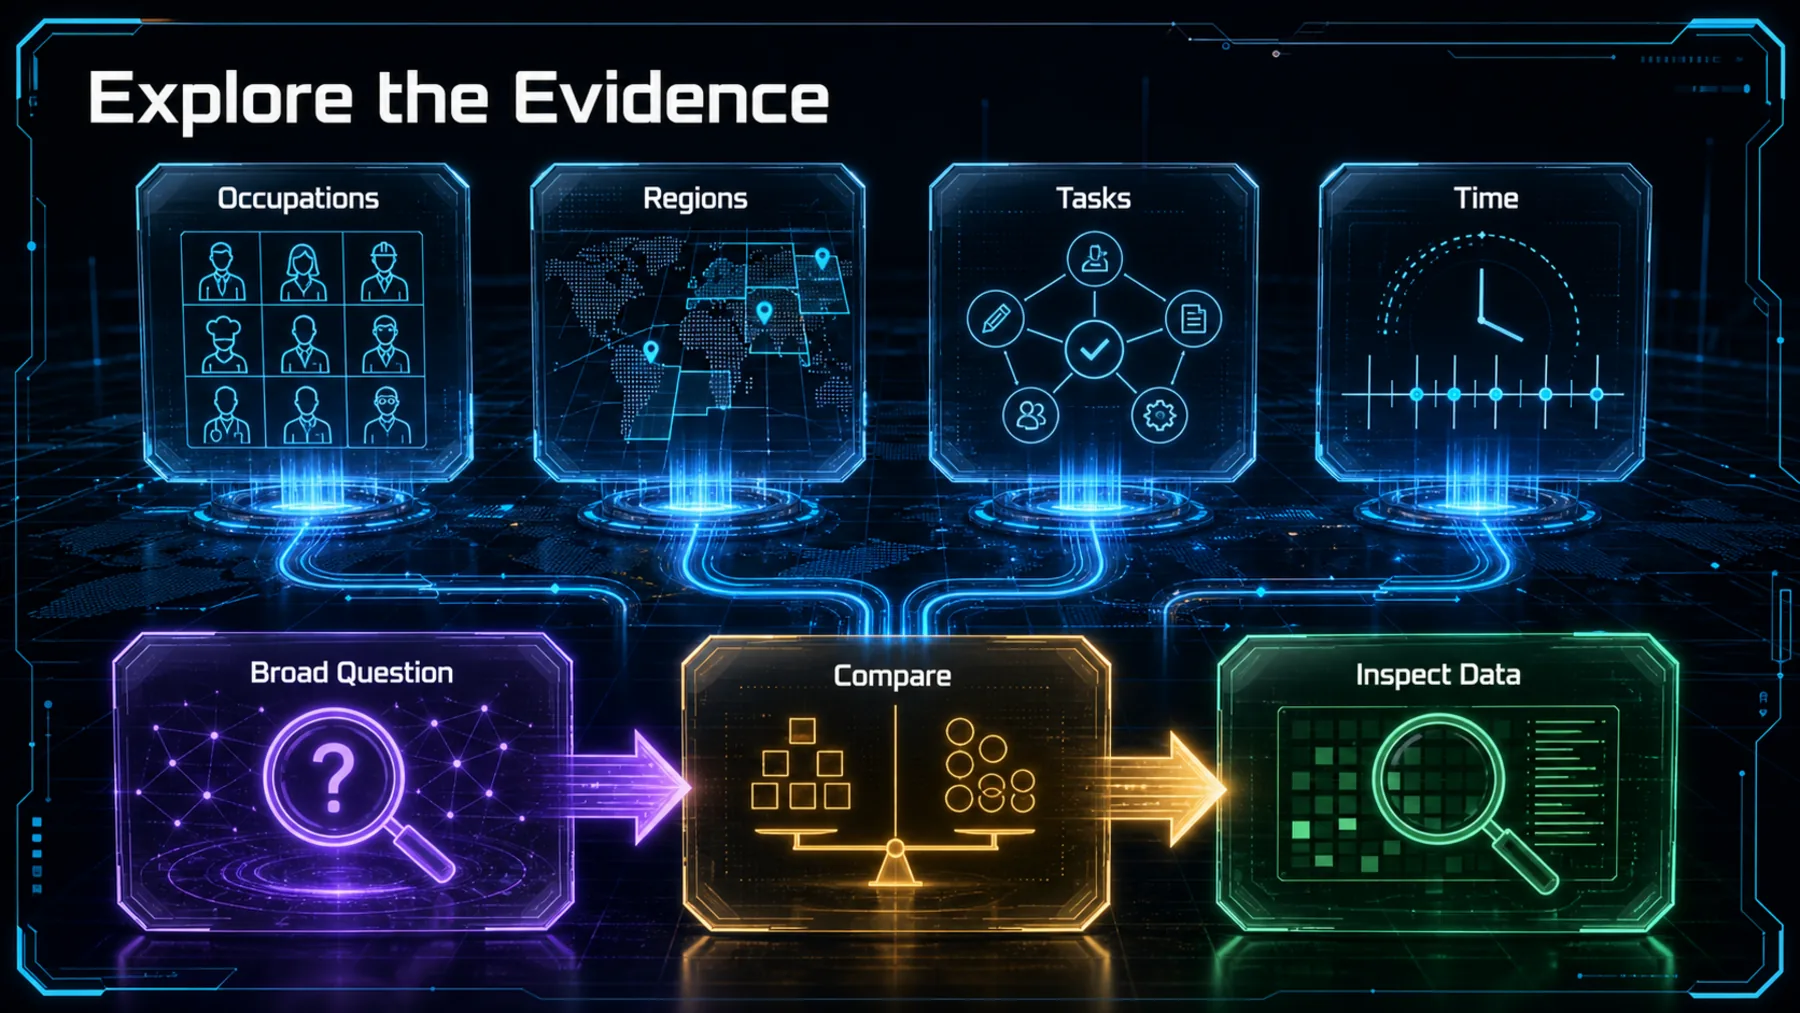
The connector supports questions about occupations, tasks, regions and change over time, followed by closer comparisons and source inspection.
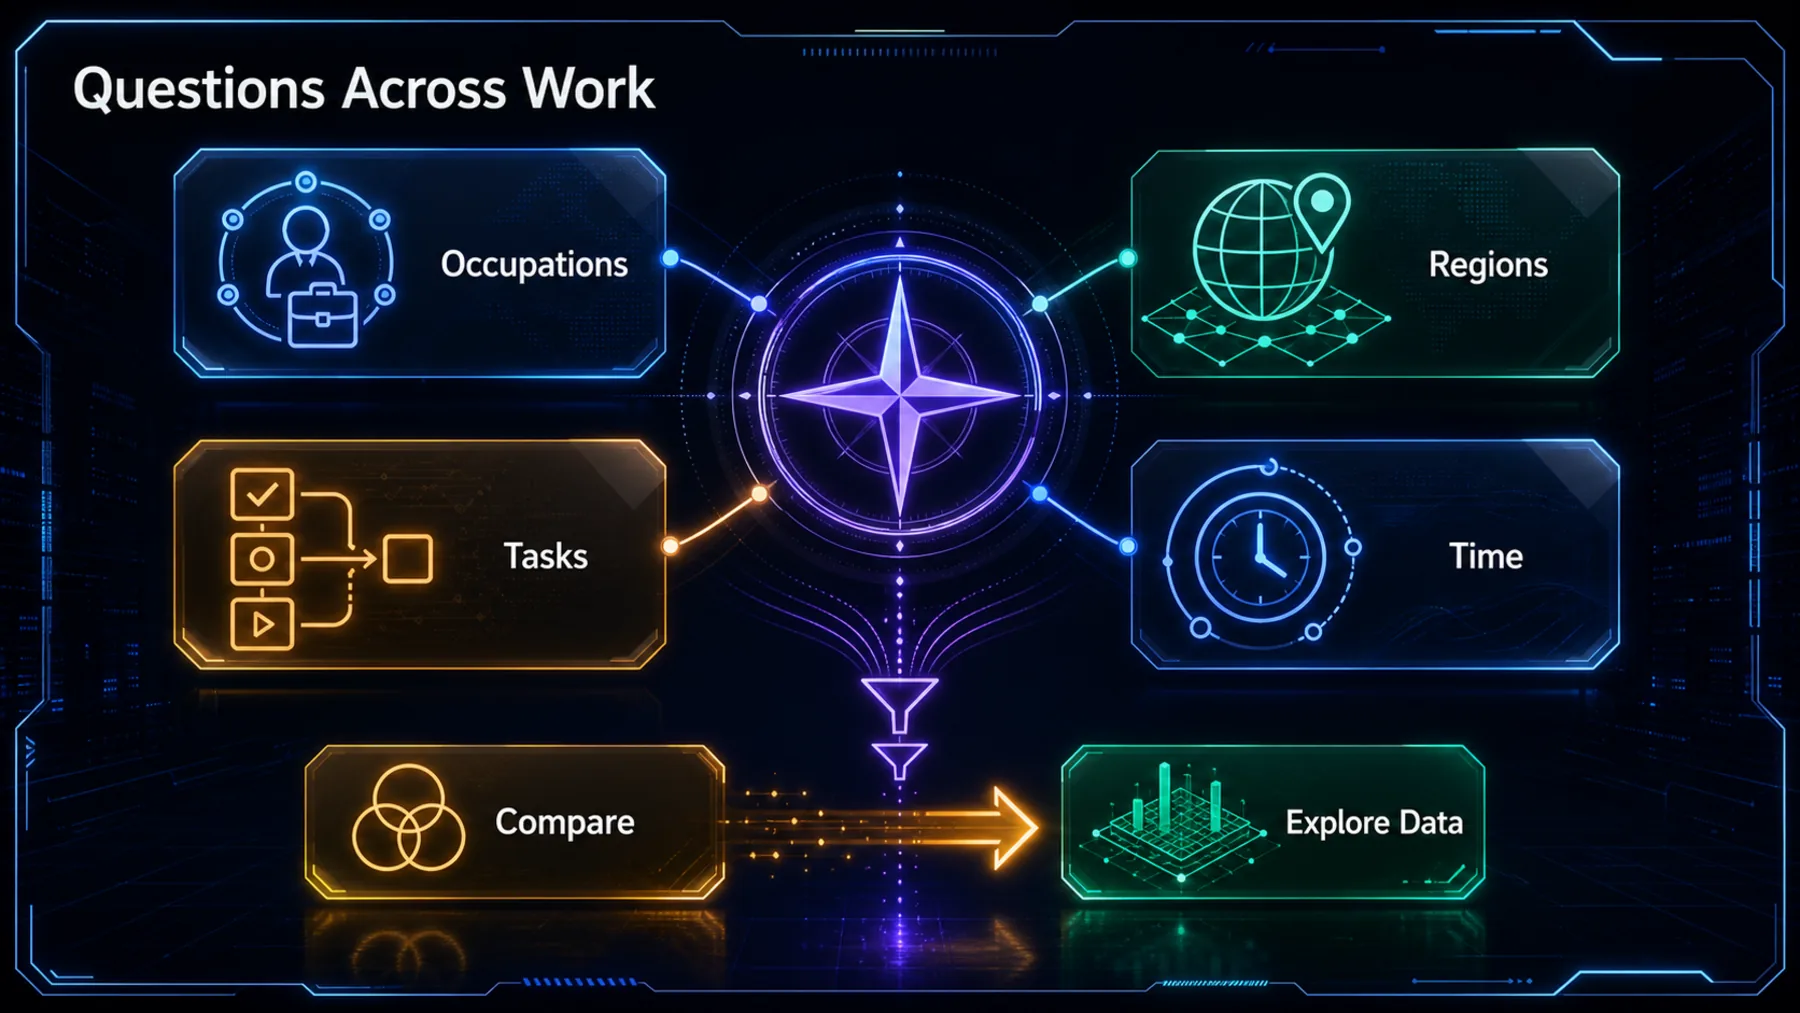
Anthropic says we can ask which occupations use AI most or what kinds of tasks people are automating. The same conversational approach can help us compare places, examine changes over time and drill into the pattern behind an initial answer.
The strongest use is iterative. Instead of accepting the first summary, we can refine the population or task, request a comparison and ask for the underlying data that supports the response.
Anthropic opens the Index to conversation
The official announcement frames the connector as a direct way to explore Economic Index data inside Claude.
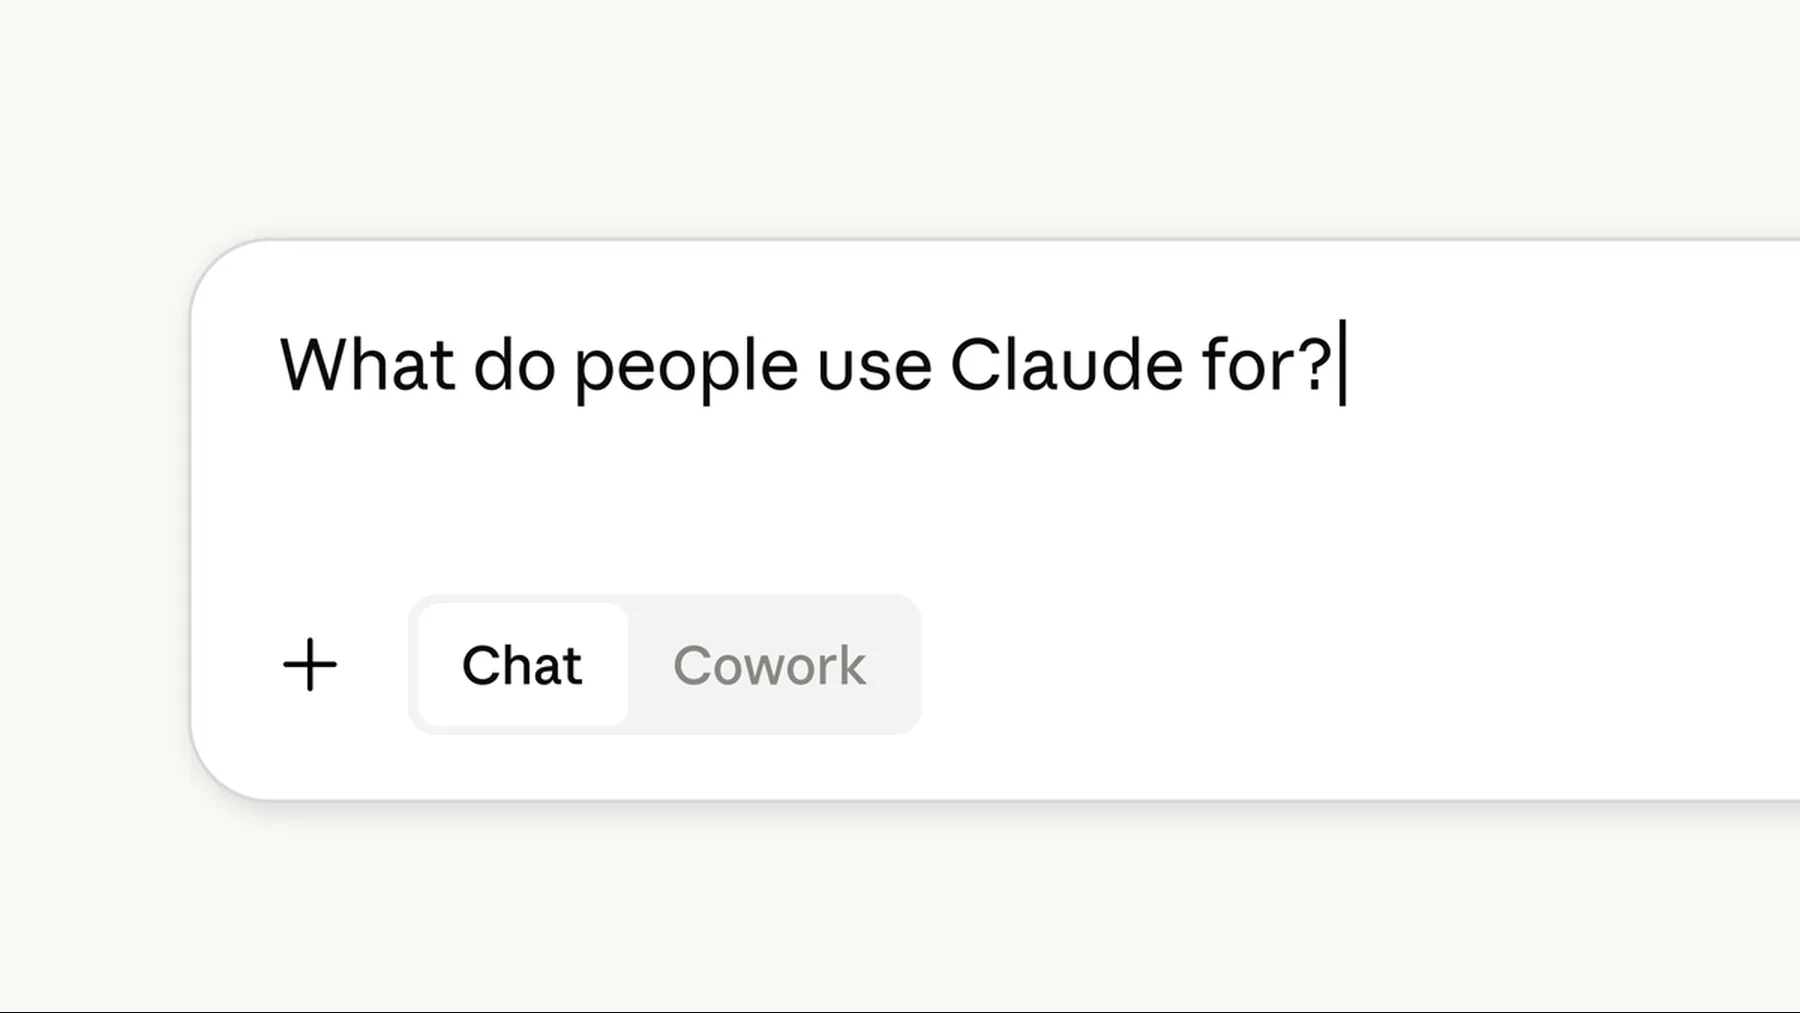
Anthropic says the connector lets anyone explore Economic Index data directly in Claude. It is available through the connectors directory in claude.ai, and Anthropic says it works in any conversation with any Claude model once enabled.
There is nothing to install, but that is not the same as automatic access: we still need to find and enable the connector. Anthropic separately says the full datasets remain freely available on its website; it does not say the connector itself is free.
Today we're launching the Anthropic Economic Index connector for Claude, which lets anyone explore that data directly.
Anthropic
A question becomes a data path
Anthropic’s demonstration shows natural-language questions drawing answers from the Index and leading towards its underlying data.

The demonstration begins with the sort of question we might already ask Claude: which occupations use AI most, or which tasks people are automating. Anthropic says the resulting answers draw directly from Economic Index data.
That is evidence of the intended interaction, not independent validation of every answer. The more defensible habit is to treat the response as the beginning of an investigation and use its route to the source data before drawing a conclusion.
Enable, ask, refine, inspect
The connector shortens the route into the Index while leaving the work of interpretation with us.
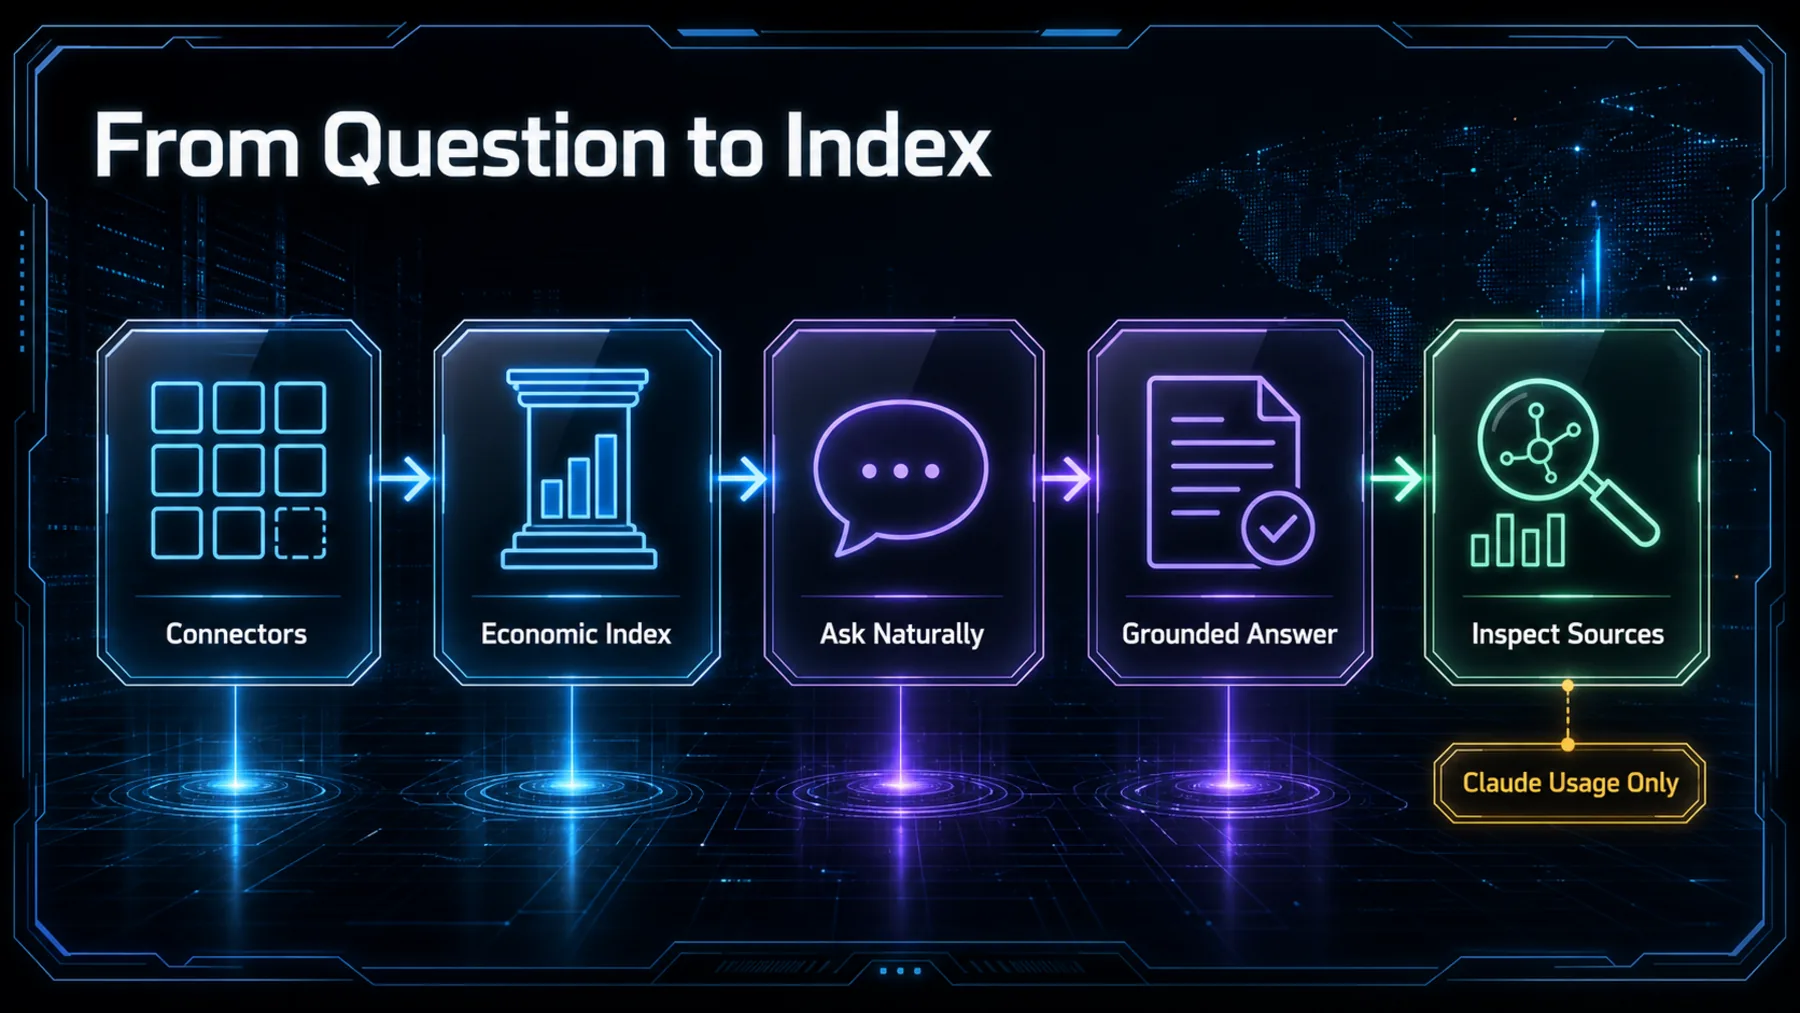
We begin in Claude’s connectors directory and enable the Anthropic Economic Index. From there, Anthropic says the connector works in any Claude conversation with any Claude model, with no separate installation.
Our question is answered using Index data, and we can continue the conversation to narrow a comparison or request the underlying data. The final interpretive boundary remains unchanged: this is evidence about Claude usage, not a complete account of employment or the economy.
Enable
Find the Anthropic Economic Index in Claude’s connectors directory and turn it on.
Interrogate
Ask naturally, then refine the occupation, task, region or period we want to compare.
Inspect
Request the underlying Index data and keep its Claude-usage boundary visible.
Our first answer is not the finish
The useful journey continues past the summary into refinement, comparison and source inspection.
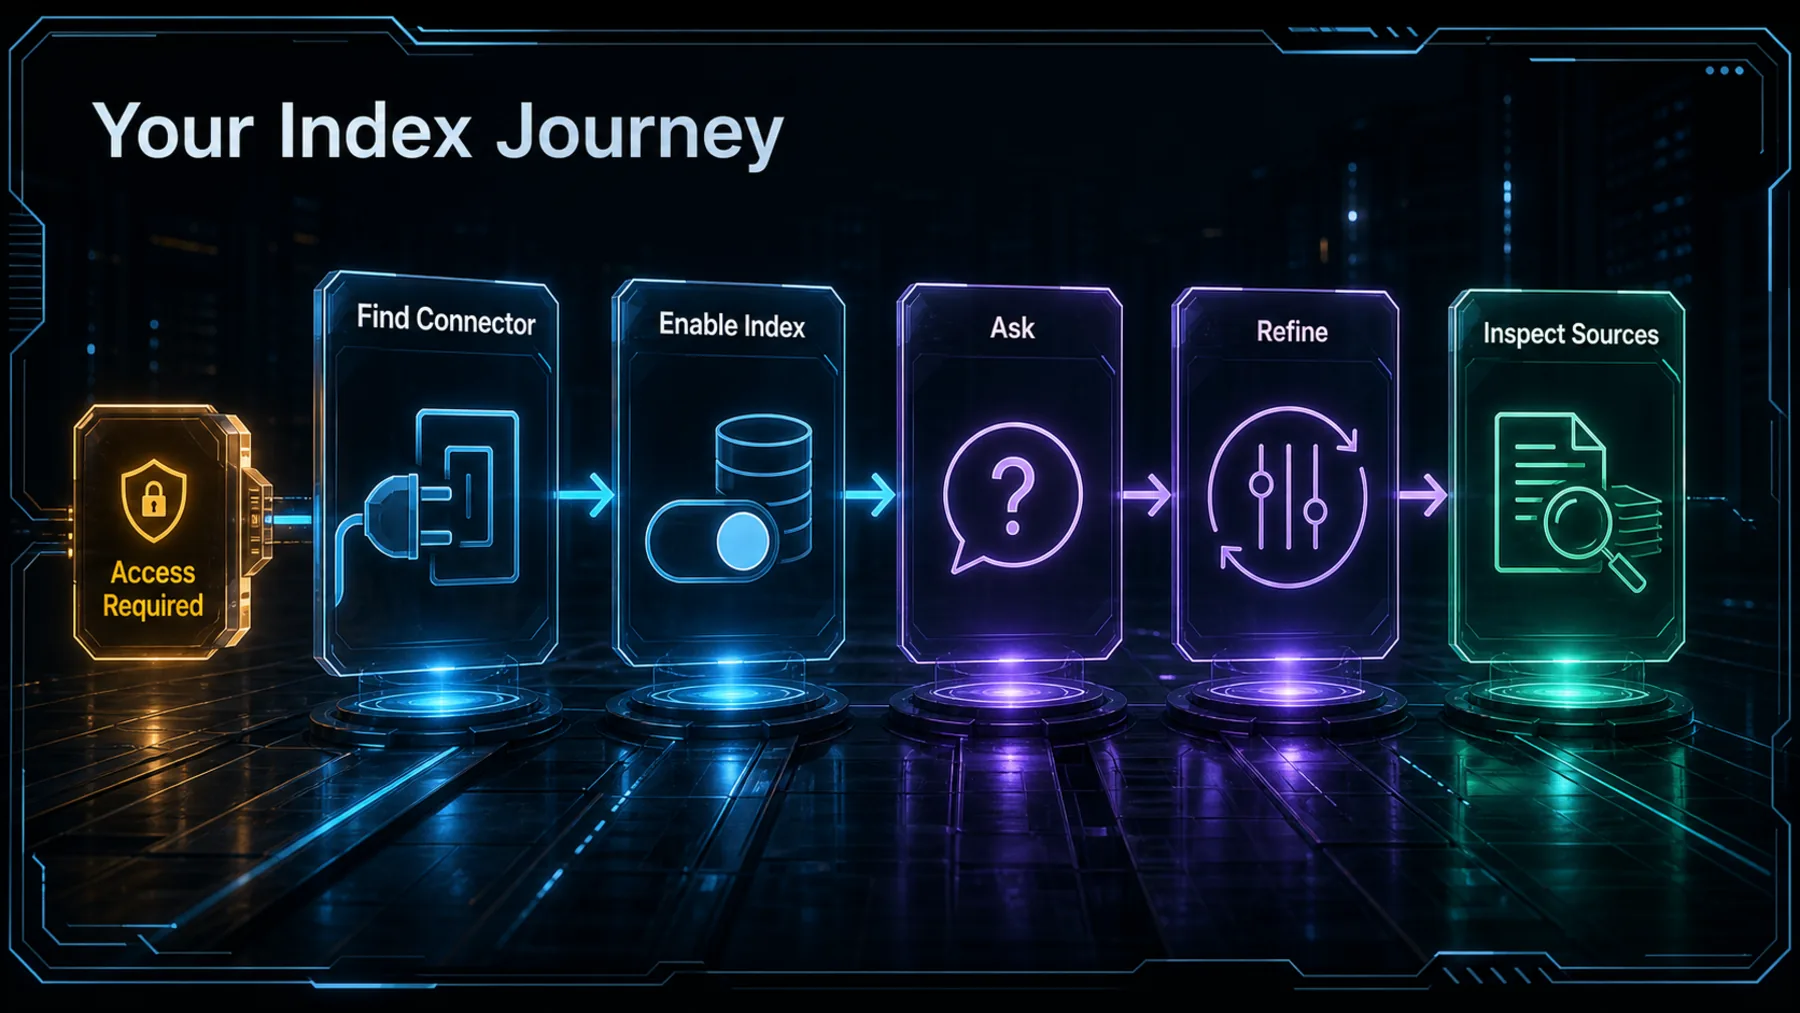
Once the connector is enabled, we can start with the question that matters to our own work: what patterns does the Index show for this occupation, task, field or place? The first answer gives us a direction rather than a verdict.
We can then tighten the question, compare categories and ask Claude to expose the supporting data. That sequence makes the connector most useful: it helps us examine Anthropic’s dataset without hiding the limits of what that dataset can establish.
Start broad
Ask the real work question we want the Index to help us examine.
Narrow it
Specify the occupation, task, region, comparison or period that matters.
Check it
Request the supporting data and separate the observed pattern from our interpretation.
A lens, not an economic oracle
Conversational access makes the Index easier to explore; it does not expand the population the Index represents.
The connector’s real achievement is modest and useful: it lowers the effort required to interrogate a public dataset. We can move from an ordinary question to a more structured comparison without first learning how to navigate the data alone.
The caution is inseparable from that convenience. Anthropic expressly says the Index reflects patterns in Claude usage rather than the labour market as a whole. We should use it to understand those patterns, compare them and form better questions—not to declare what AI is doing to every job.
The connector makes Anthropic’s dataset easier to question. It does not make that dataset a verdict on the whole labour market.
Altior synthesis, grounded in Anthropic’s stated scope
Interrogate one Economic Index claim
Using the Anthropic Economic Index connector in Claude, investigate how AI use differs between software developers and teachers. Compare the occupations by common tasks, automation versus augmentation patterns, and any change over time available in the Index. For every conclusion, identify the supporting Index measure or underlying data, distinguish observation from interpretation, and state explicitly that the dataset reflects Claude usage rather than the whole labour market. Return a concise comparison table followed by three evidence-backed takeaways and two questions the data cannot answer.Ready to copy
Keep the boundary in view
Enable the connector, ask the question that matters to our work, then refine it until the supporting Index data is visible. The result can sharpen our understanding of Claude usage—provided we do not mistake that lens for the whole labour market.
Try the promptWhat could change the takeaway
- Dataset updates
- Scope statements
- Connector access
- Source visibility